Topographic map clipped by coastlines in Python (codes included)
This post demonstrate how to use Python to set up clip topographic map based on coastlines.

Earth Inversion
Practical tutorials, research insights, and reproducible workflows for Earth science problems with modern coding tools.
Seismology, geophysics, and Earth-system investigations with quantitative methods.
Applied Python workflows for scientific computing, statistics, and visual analytics.
Hands-on web development patterns for publishing interactive technical work.
This post demonstrate how to use Python to set up clip topographic map based on coastlines.

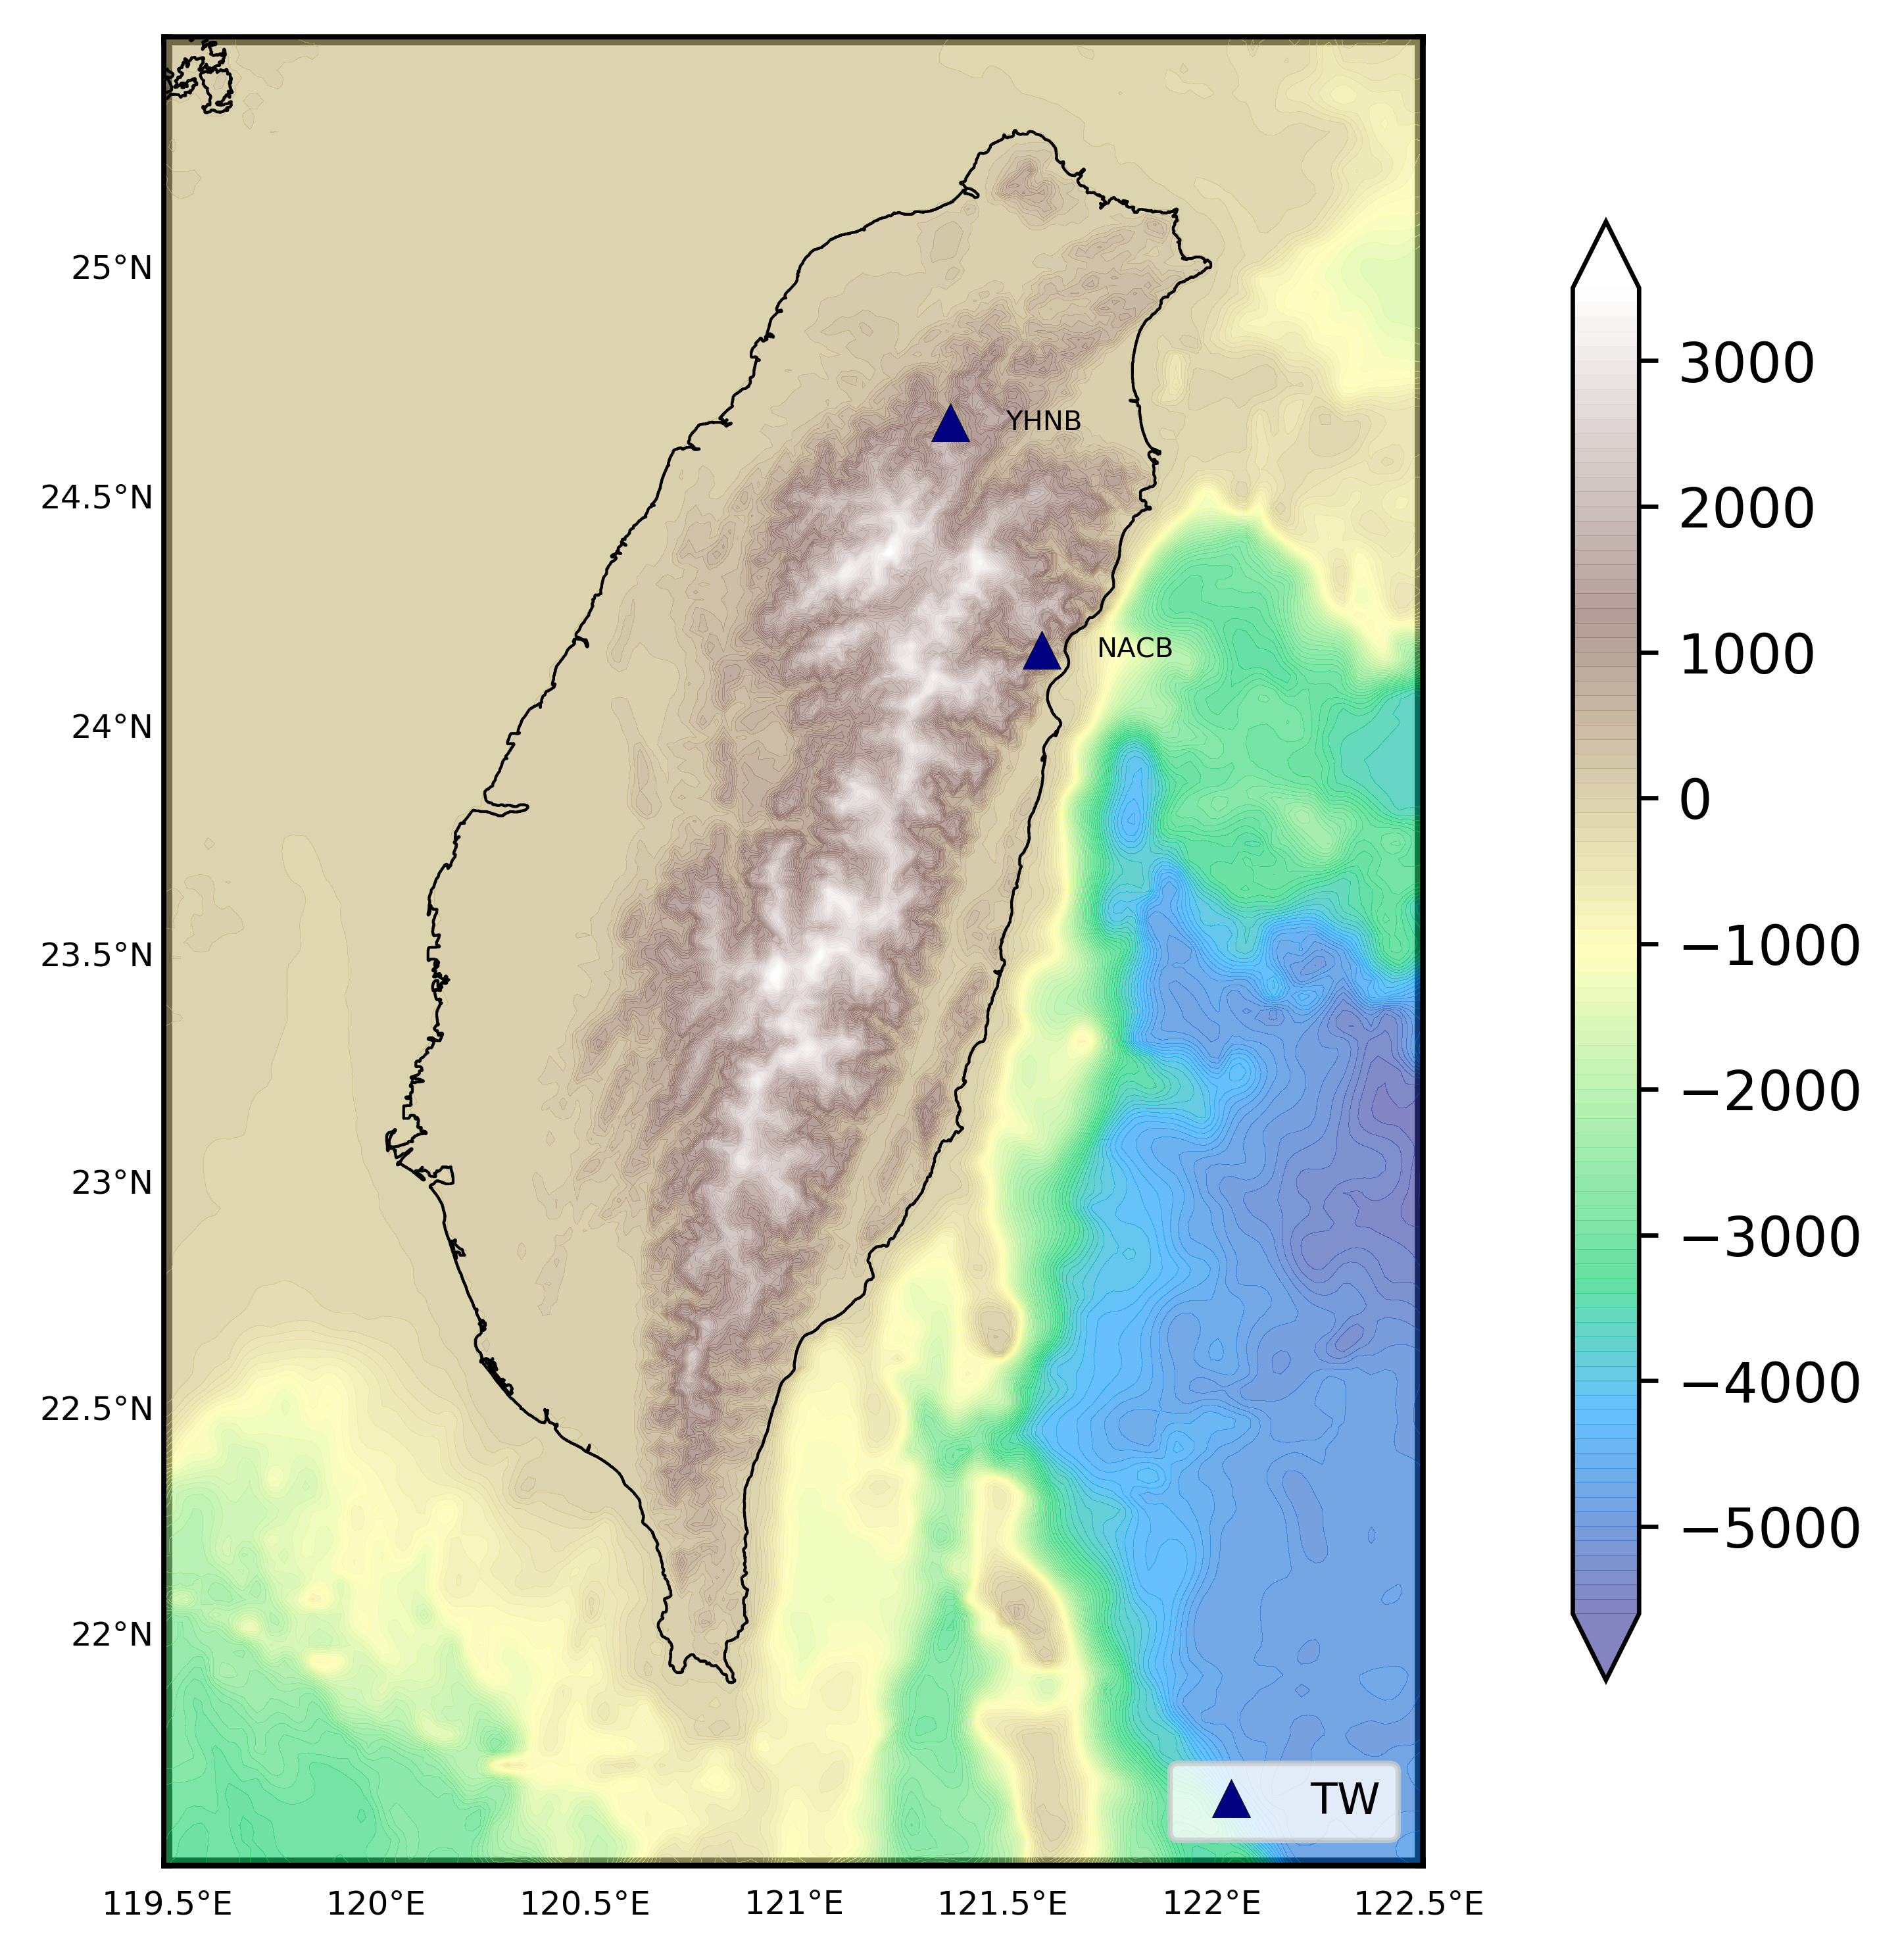
Generating GMT style shaded relief map in Python
Latest articles on geophysics, scientific computing, numerical methods, and applied data workflows.
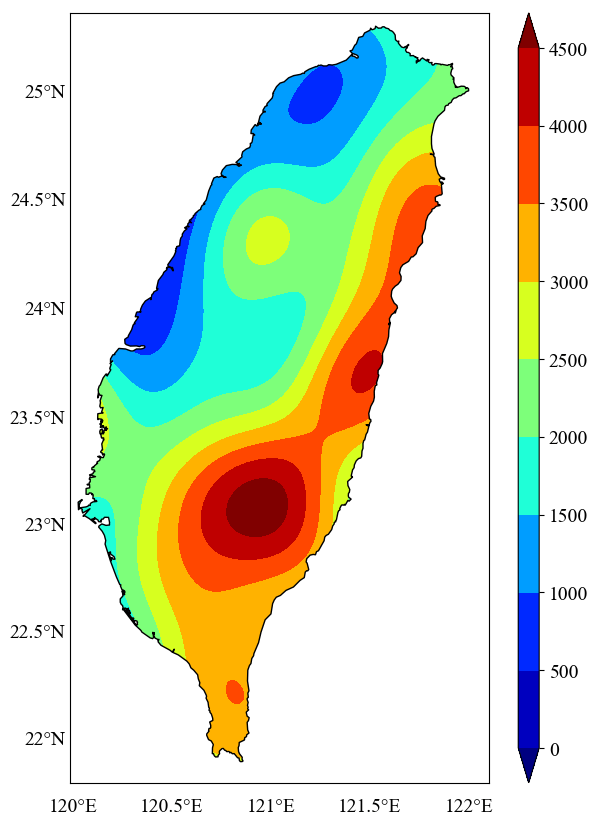
In geosciences, we most frequently have to make geospatial plots, but the available data is unevenly distributed and irregular. We like to show the data, in ...
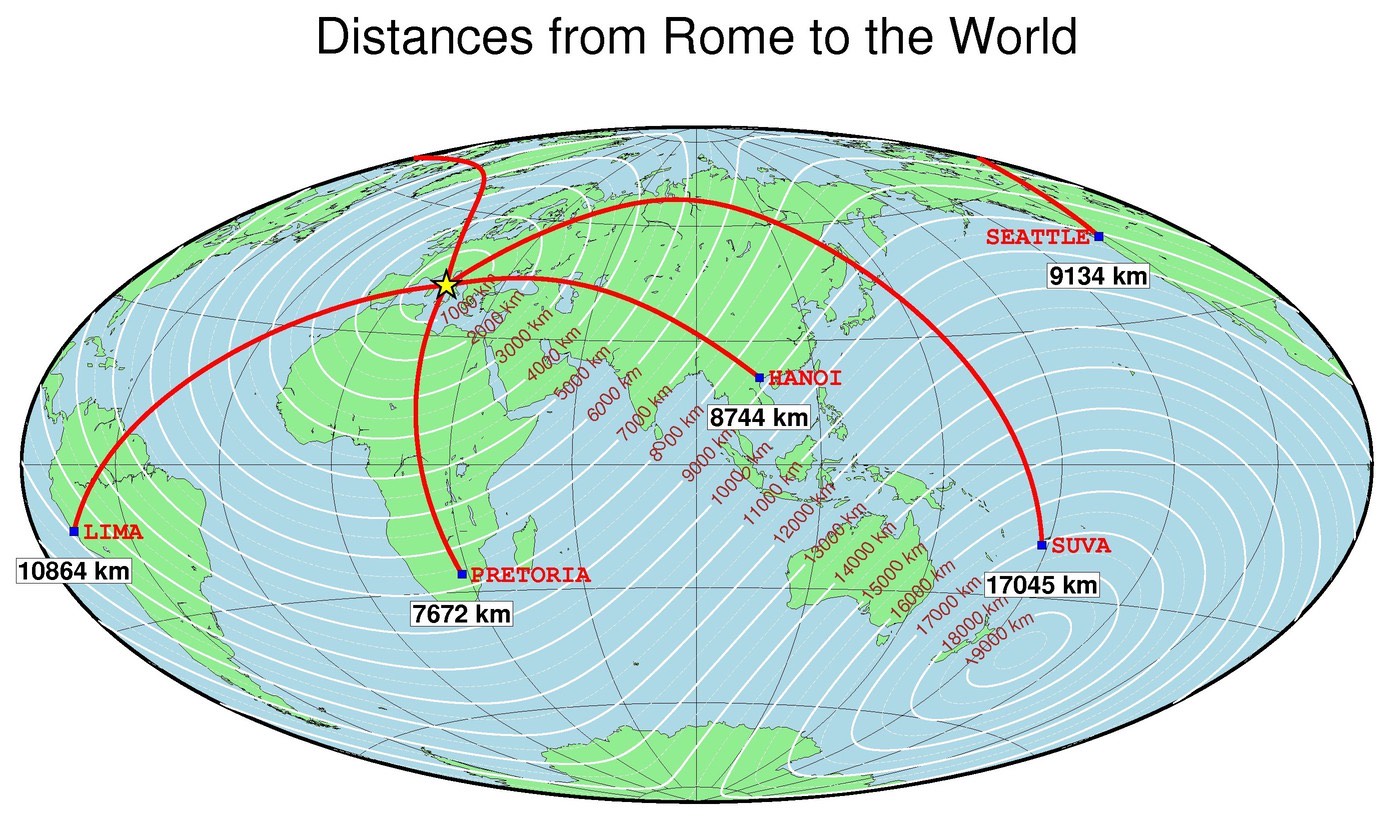
We read the station information from a file to plot the 1 arc-minute relief map
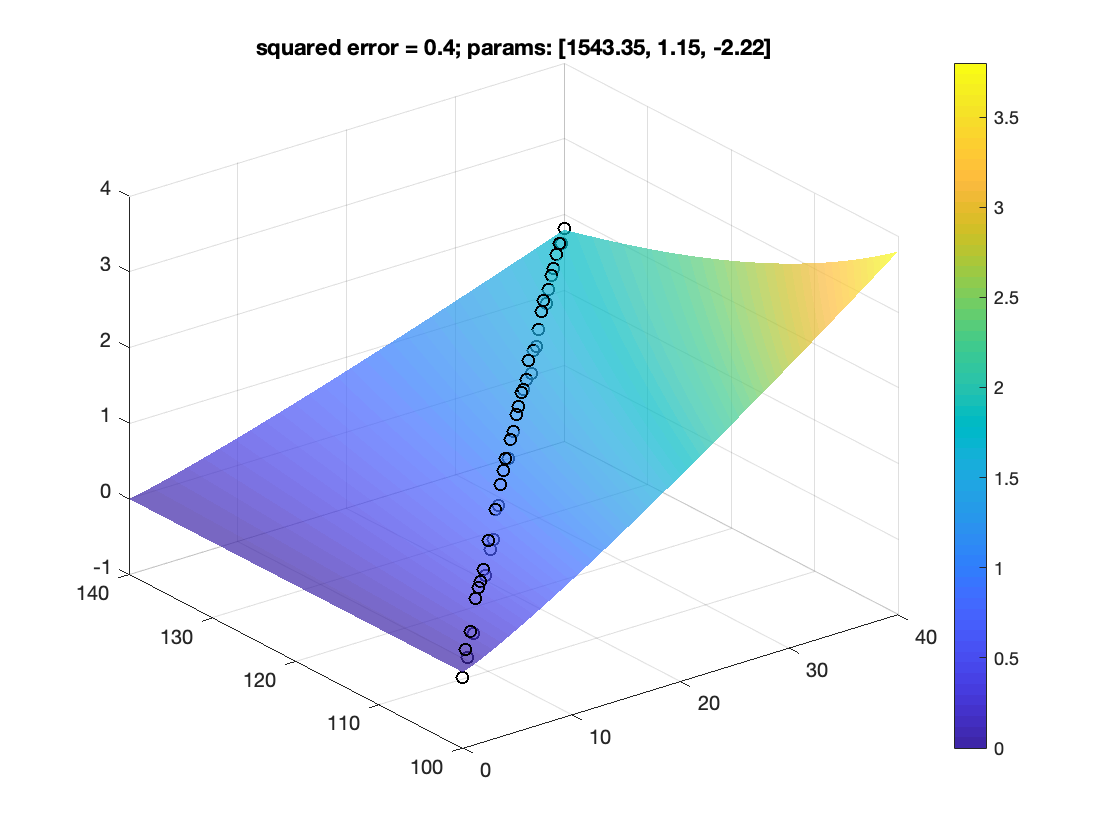
How to fit data to non-linear model
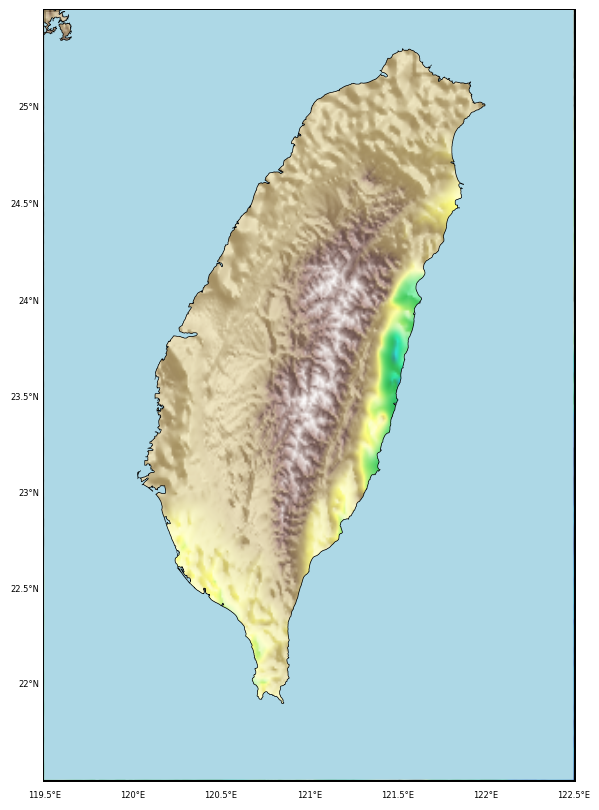
Plotting 1 arc-minute topographic map in python
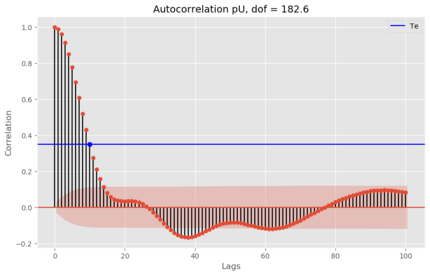
Two time series with predominant linear trends (very low DOF) can have a very high correlation coefficient, which can hardly be construed as an evidence for ...
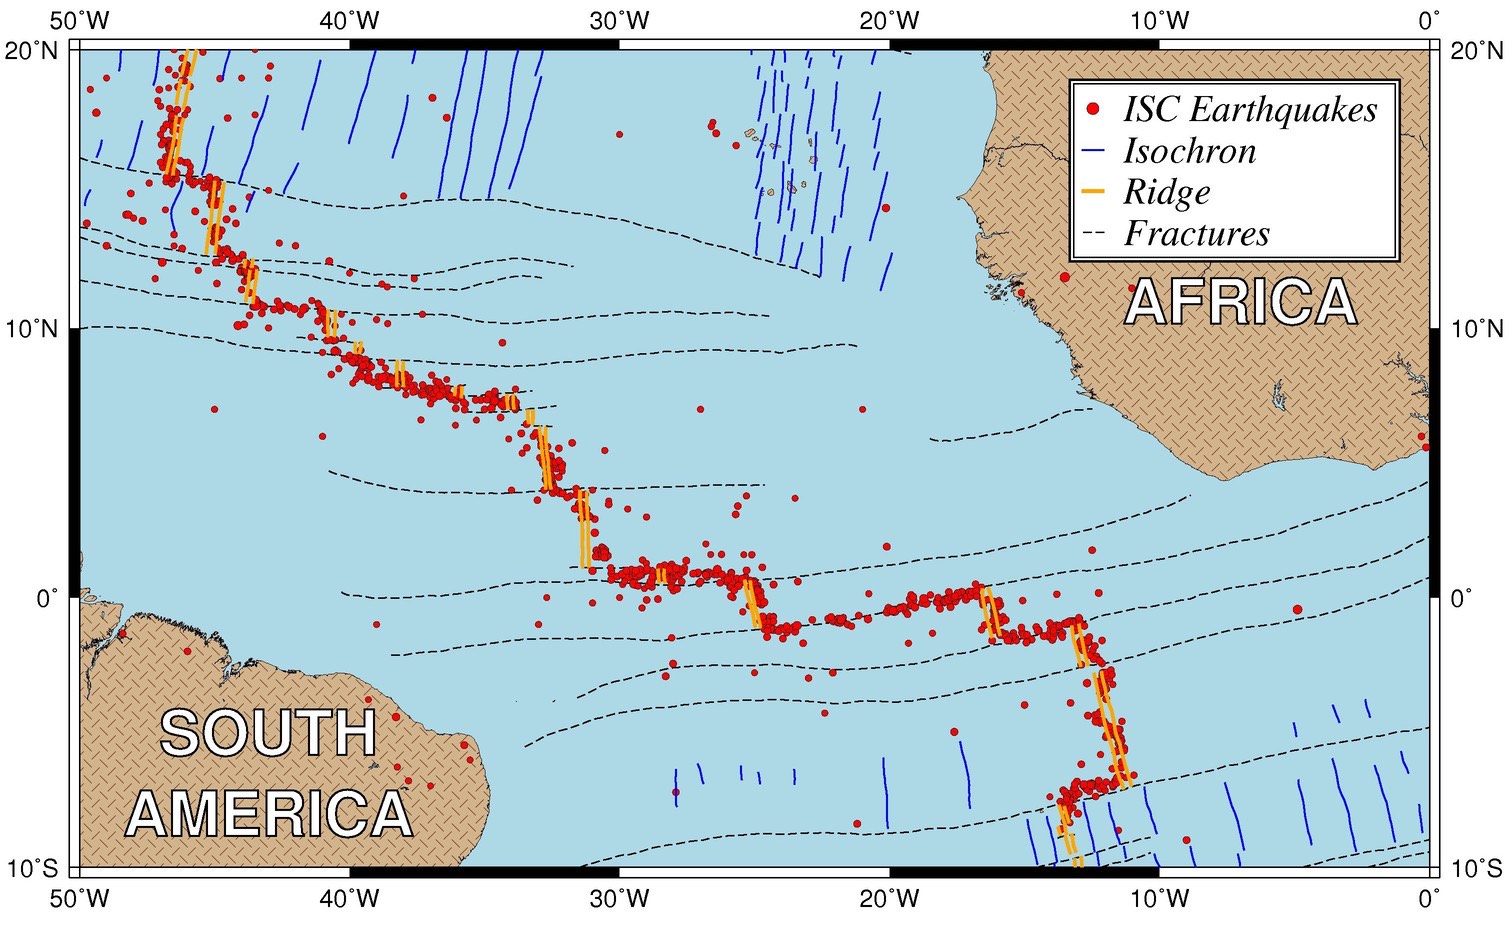
Plotting publishable quality maps using generic mapping tools (GMT)
A basic to advanced guide to making interactive plots in Bokeh.
Generators don’t hold the entire result in memory. It yields one result at a time.
Plotting publishable quality maps using generic mapping tools (GMT)
Tutorial on how to use Git and GitHub for team collaboration on a project. Content includes installing, setting up, creating a repository, making commits, un...
In this tutorial post, I give a quick demo of how to install Python (using anaconda) and then getting started with writing simple scripts.
In geosciences, we most frequently have to make geospatial plots, but the available data is unevenly distributed and irregular. We like to show the data, in ...
We read the station information from a file to plot the 1 arc-minute relief map
How to fit data to non-linear model
Plotting 1 arc-minute topographic map in python
Two time series with predominant linear trends (very low DOF) can have a very high correlation coefficient, which can hardly be construed as an evidence for ...
Plotting publishable quality maps using generic mapping tools (GMT)
A basic to advanced guide to making interactive plots in Bokeh.
Generators don’t hold the entire result in memory. It yields one result at a time.
Plotting publishable quality maps using generic mapping tools (GMT)
Tutorial on how to use Git and GitHub for team collaboration on a project. Content includes installing, setting up, creating a repository, making commits, un...
In this tutorial post, I give a quick demo of how to install Python (using anaconda) and then getting started with writing simple scripts.

![Why we should use generators? [python]](https://raw.githubusercontent.com/earthinversion/earthinversion-images/main/images/results_generators.png)