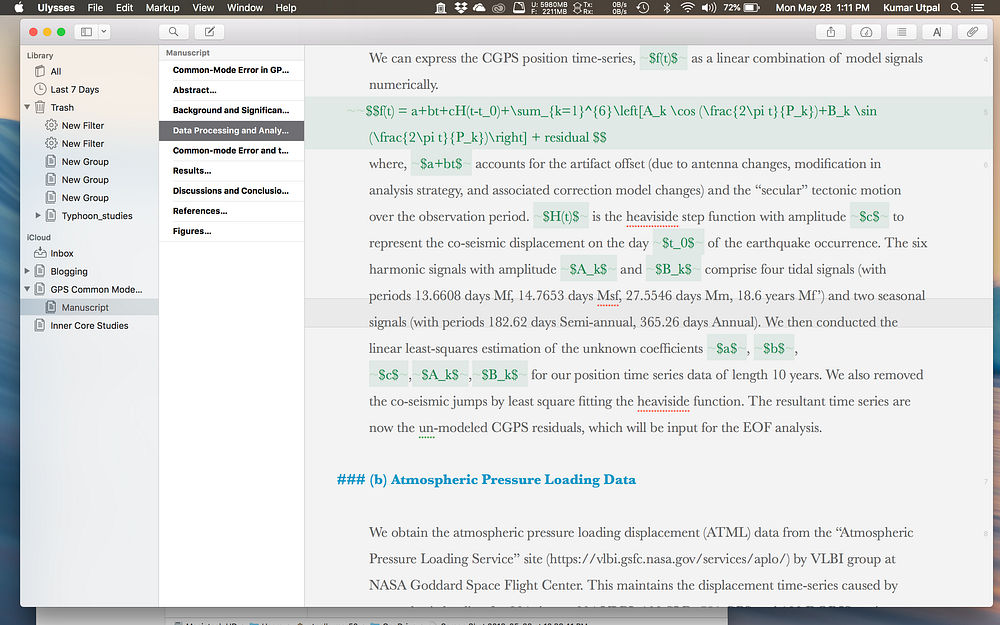
Writing scientific papers in Ulysses
Ulysses is a natural, freestyle way of writing. If you got any idea, just write it down, worry about the fo...

Earth Inversion
Practical tutorials, research insights, and reproducible workflows for Earth science problems with modern coding tools.
Seismology, geophysics, and Earth-system investigations with quantitative methods.
Applied Python workflows for scientific computing, statistics, and visual analytics.
Hands-on web development patterns for publishing interactive technical work.
Ulysses is a natural, freestyle way of writing. If you got any idea, just write it down, worry about the fo...

A simple tutorial on how to plot high resolution topographic map using GMT tools in Python
Latest articles on geophysics, scientific computing, numerical methods, and applied data workflows.
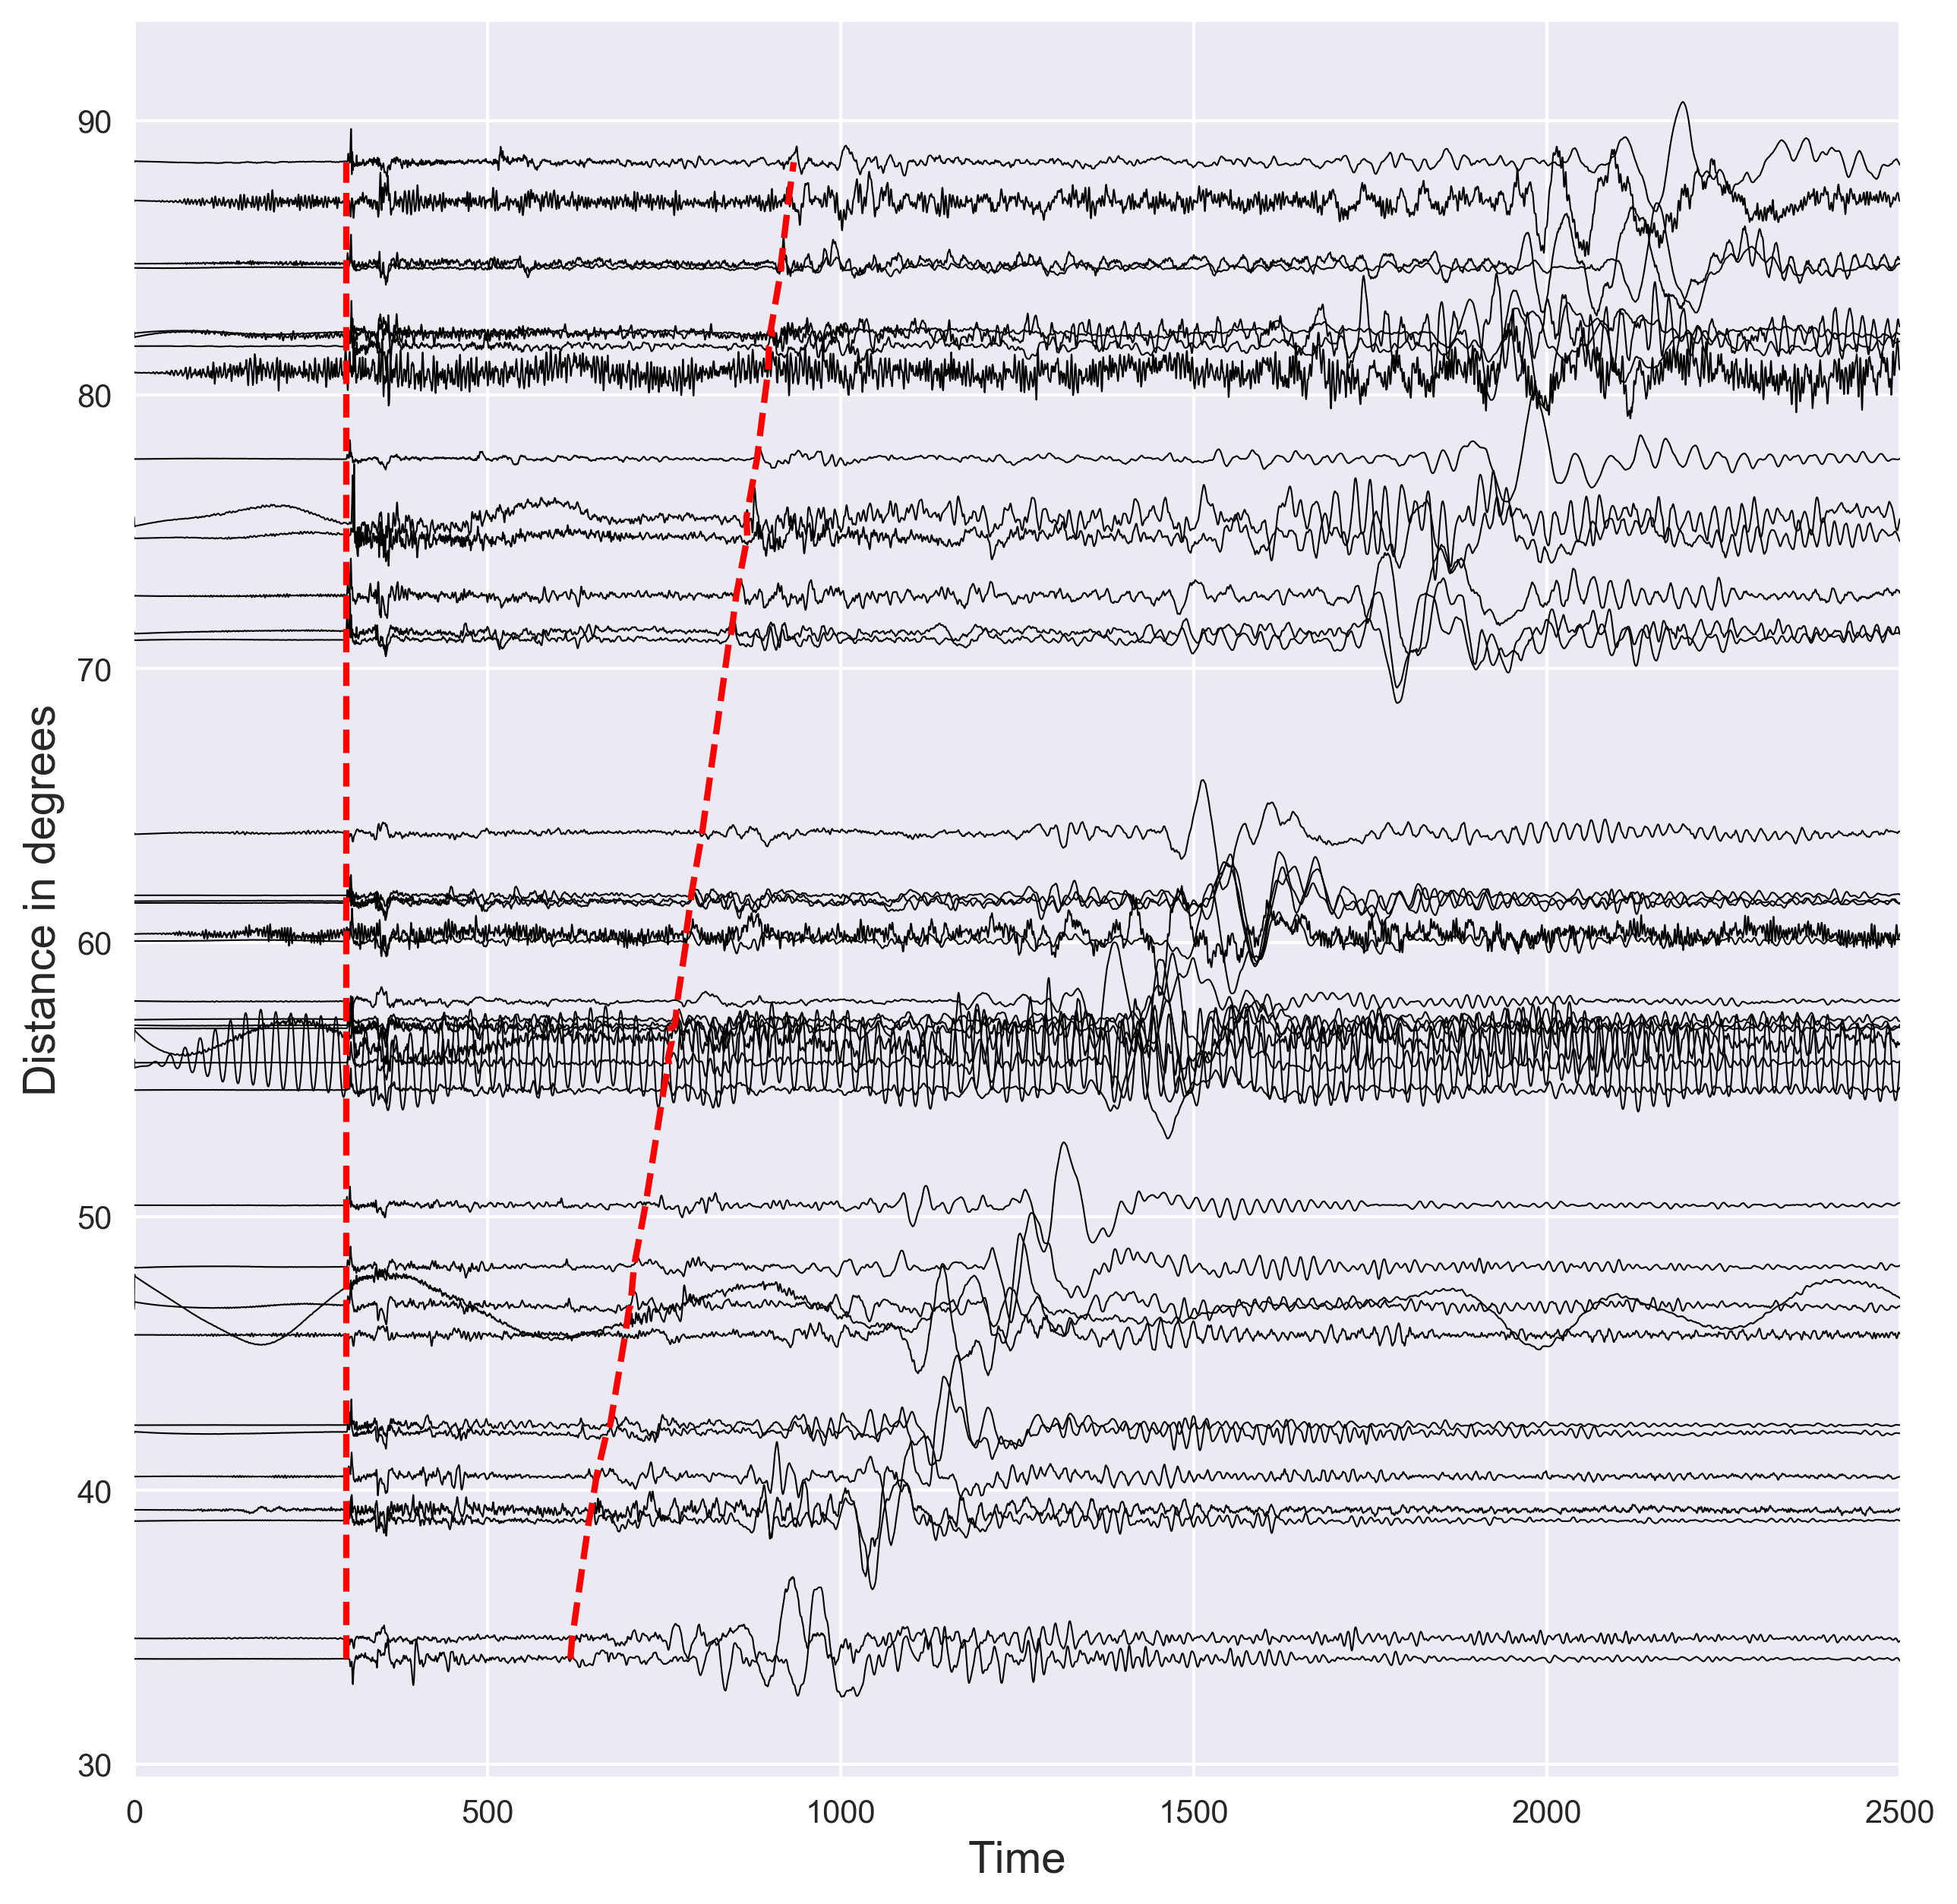
Short demostration of how to plot the distance vs seismic waveforms and mark the P and S arrival times using the IASP91 earth model. Codes are included.
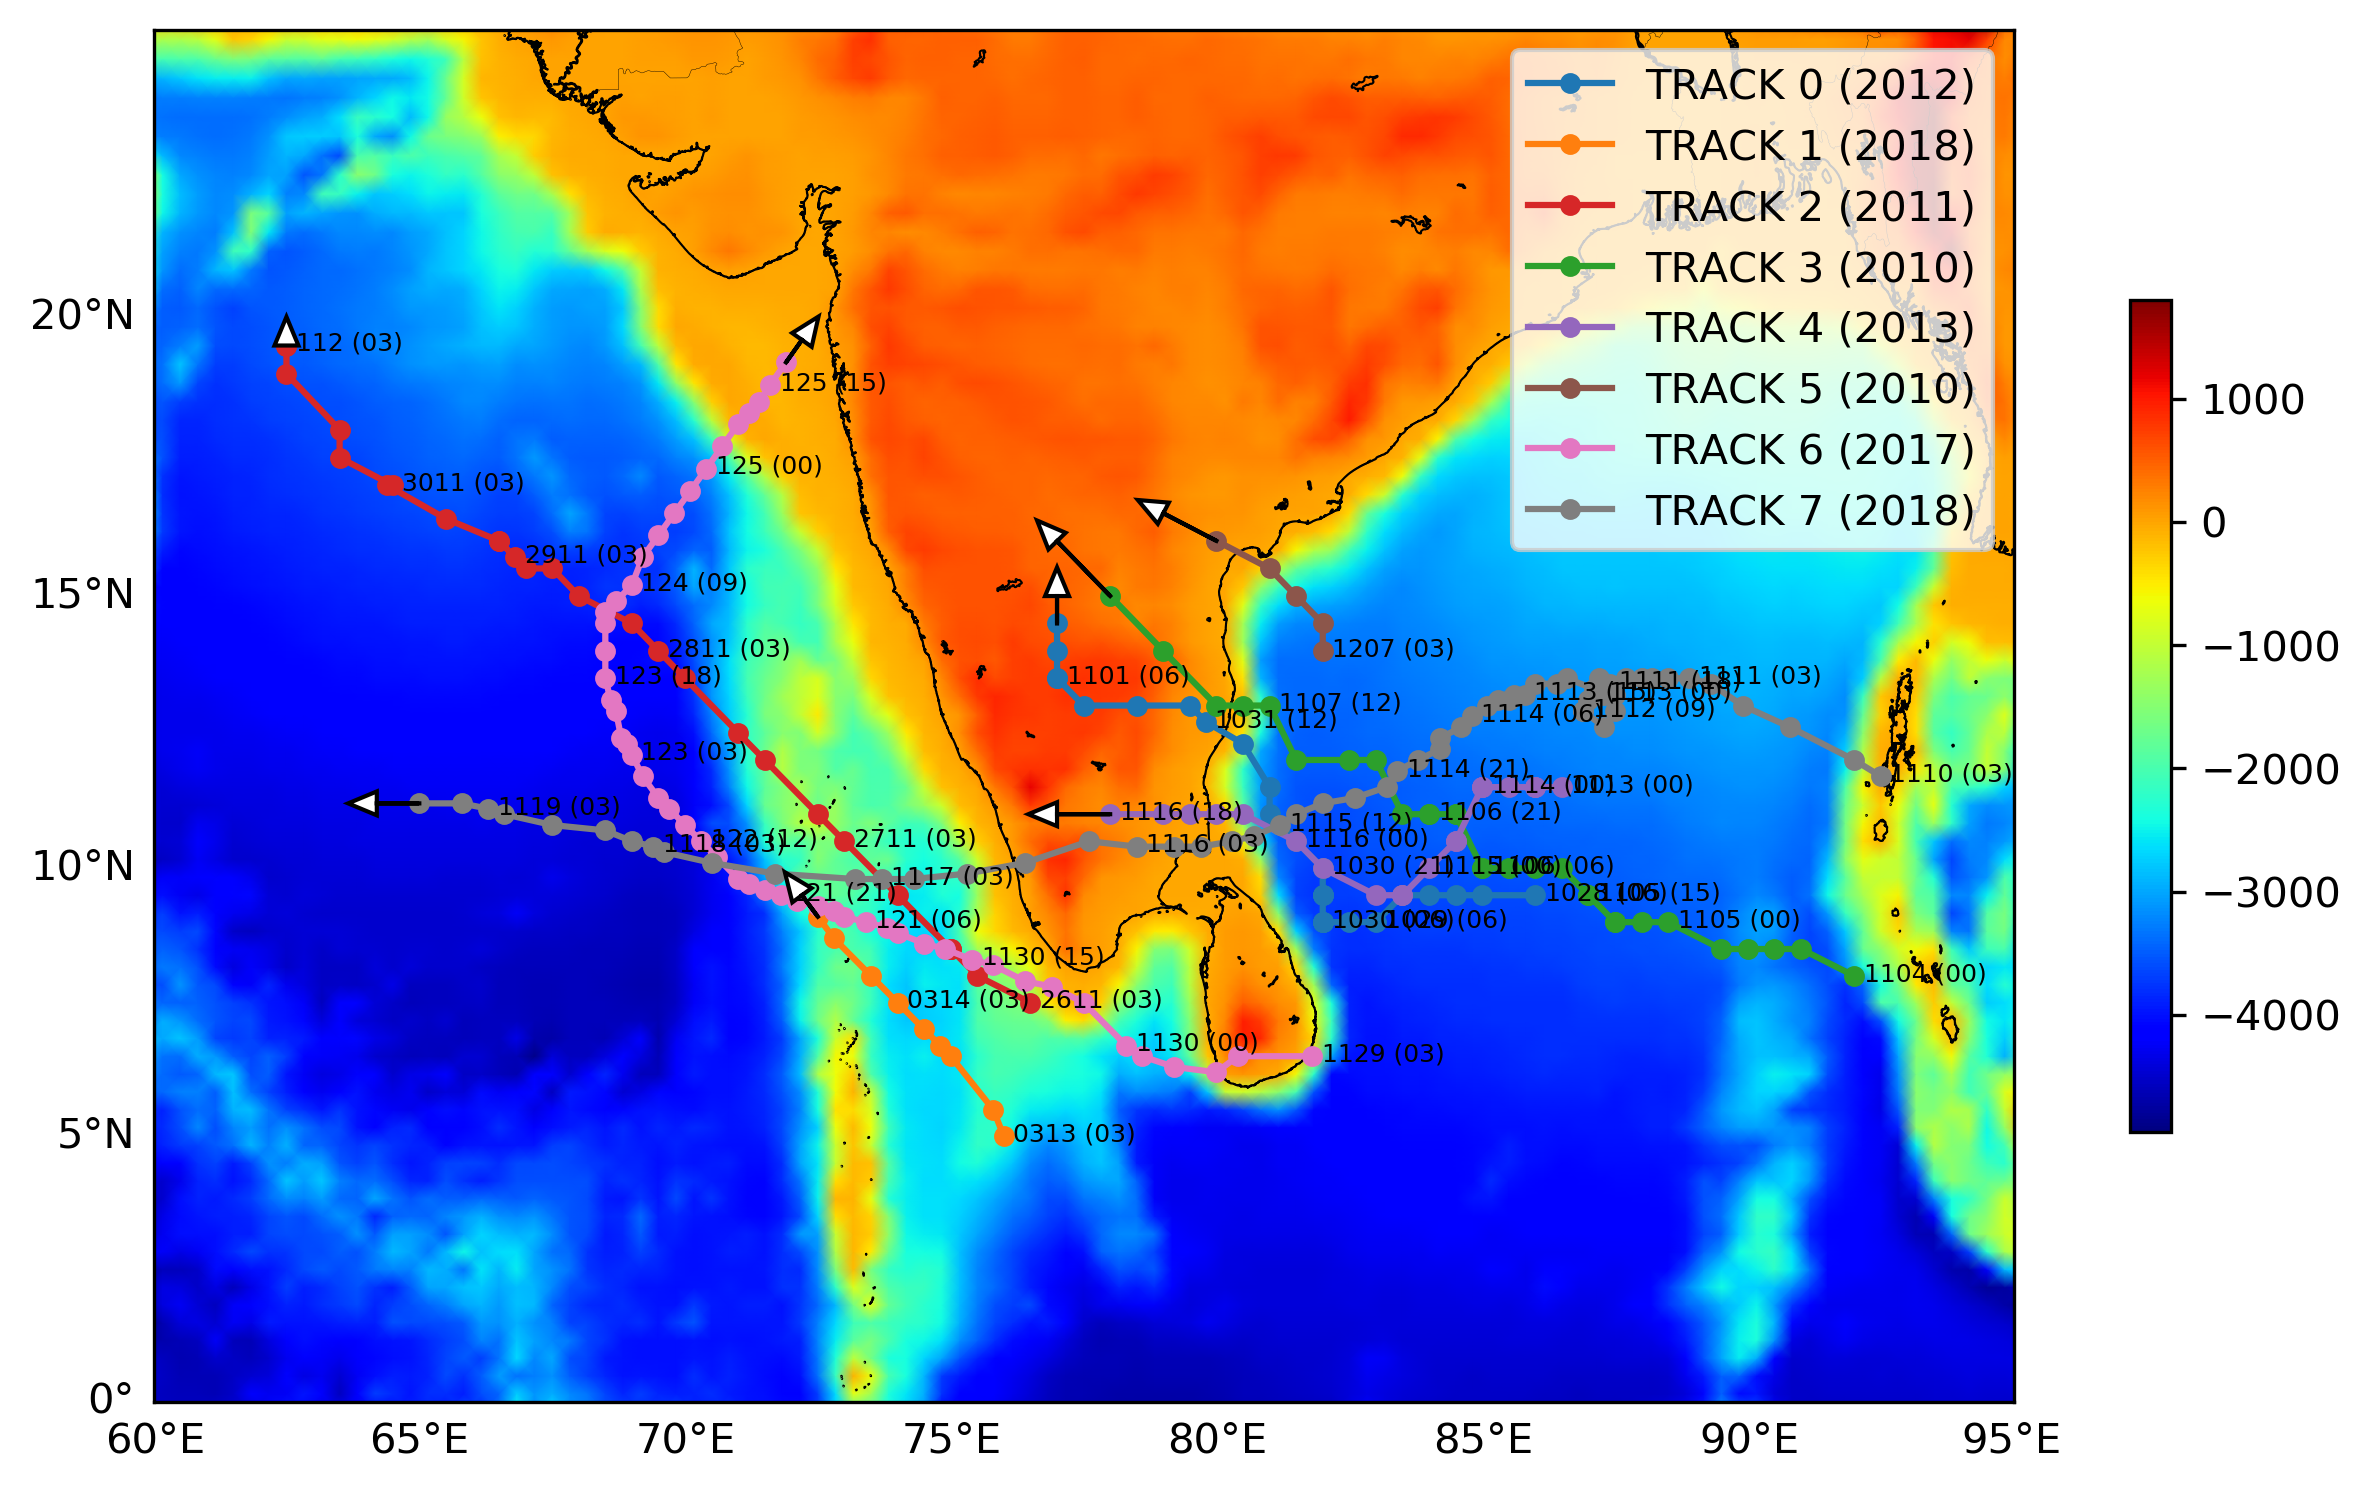
Short demonstration of how to plot the track or trajectory of a hurricane on a map. Codes are included.
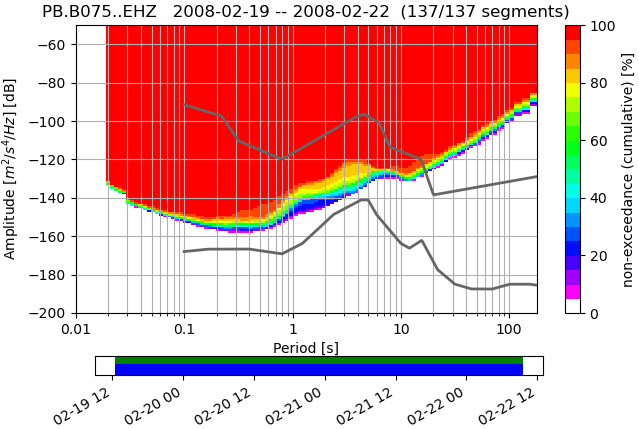
Short demonstration of the ppsd class defined in Obspy using 3 days of data for station PB-B075
Some handy tweaks for mac like relocating default screenshot location, renaming batch files etc
Mac can be easily automated by the help of several tools such as automator, quick actions, applescripts
Shortcut code for quickly logging temperature in Apple health app
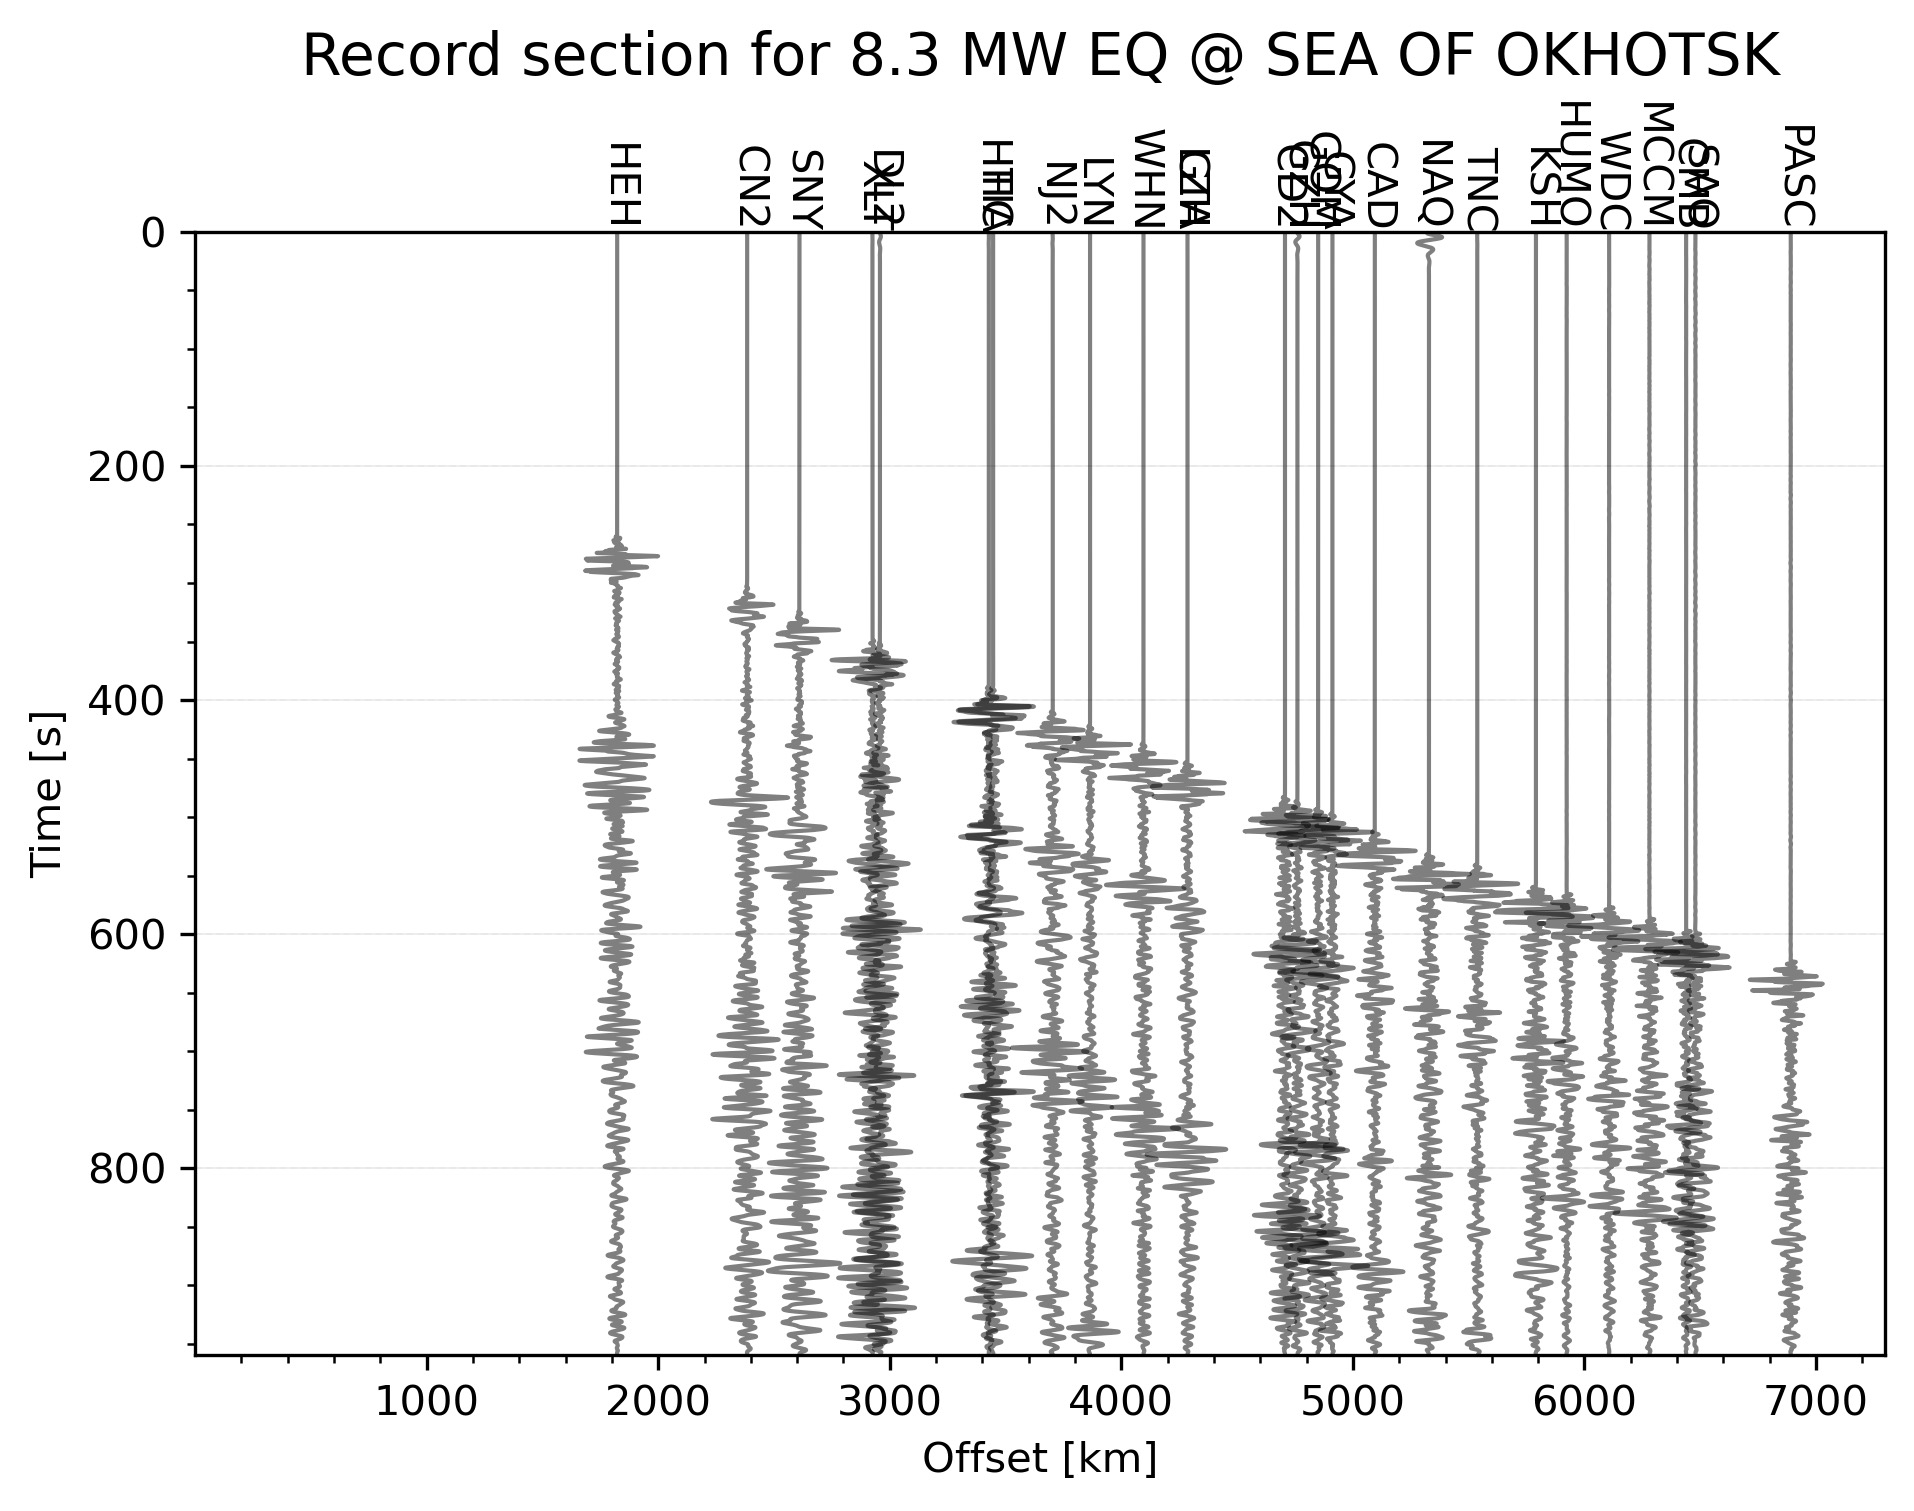
Python code to automatically plot the record section for the highest magnitude earthquake in the given time range
Quick action for mac to easily love, dislike, rate songs in apple music app
Introduction to the concepts of tomography with equations and codes. Introduction to the concepts of overdetermined, underdetermined and mix-determined probl...
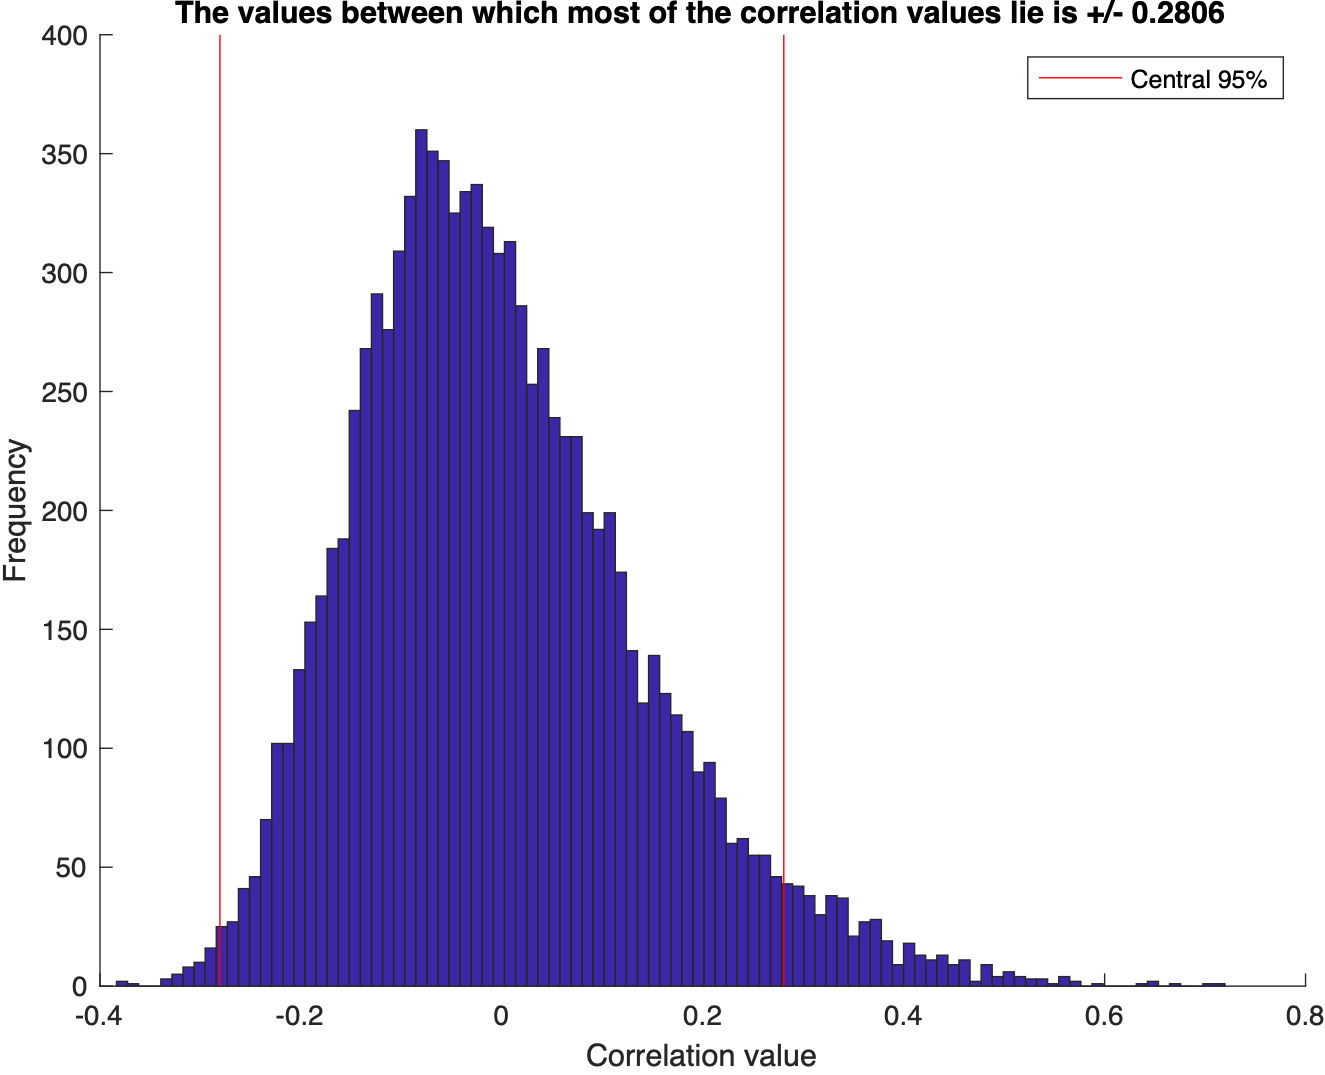
We test for the correlation coefficients or the covariance between two sets of random numbers selected from normal distribution using the Monte Carlo simulat...
Visualize the statistics of the data using MATLAB: mean, median, std, interquartile range, skewness, kurtosis, t-statistic, degrees of freedom
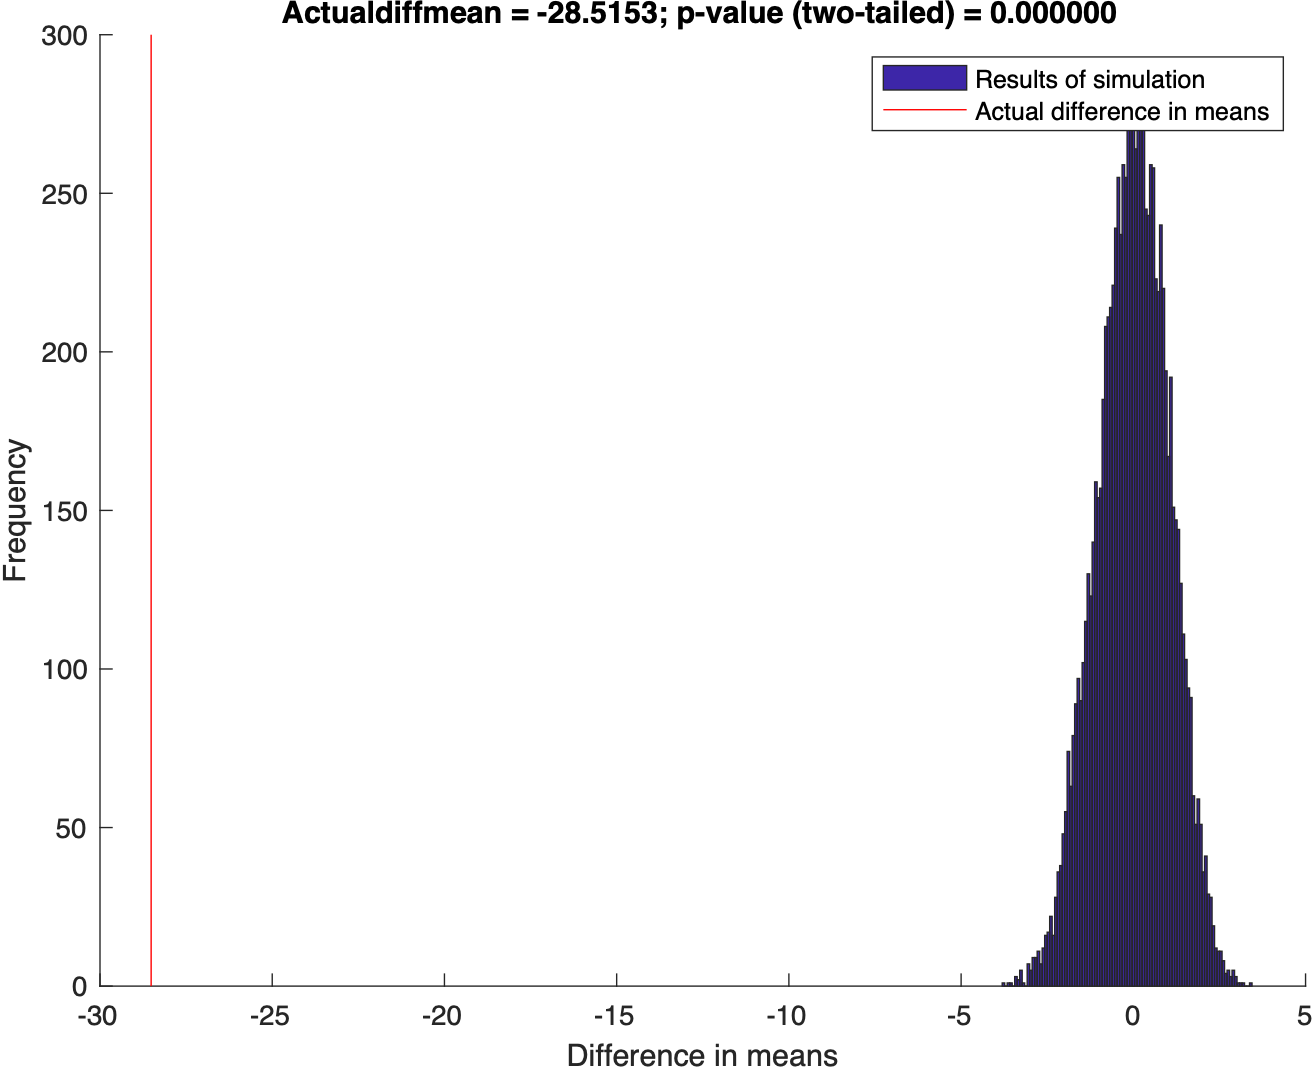
Using Randomization to test the disprove the null hypothesis
Short demostration of how to plot the distance vs seismic waveforms and mark the P and S arrival times using the IASP91 earth model. Codes are included.
Short demonstration of how to plot the track or trajectory of a hurricane on a map. Codes are included.
Short demonstration of the ppsd class defined in Obspy using 3 days of data for station PB-B075
Some handy tweaks for mac like relocating default screenshot location, renaming batch files etc
Mac can be easily automated by the help of several tools such as automator, quick actions, applescripts
Shortcut code for quickly logging temperature in Apple health app
Python code to automatically plot the record section for the highest magnitude earthquake in the given time range
Quick action for mac to easily love, dislike, rate songs in apple music app
Introduction to the concepts of tomography with equations and codes. Introduction to the concepts of overdetermined, underdetermined and mix-determined probl...
We test for the correlation coefficients or the covariance between two sets of random numbers selected from normal distribution using the Monte Carlo simulat...
Visualize the statistics of the data using MATLAB: mean, median, std, interquartile range, skewness, kurtosis, t-statistic, degrees of freedom
Using Randomization to test the disprove the null hypothesis
![Some handy mac tweaks [macos]](https://raw.githubusercontent.com/earthinversion/earthinversion-images/main/images/mac-tweaks/open-in-terminal.jpg)
![Introduction to automating mac [macos]](https://raw.githubusercontent.com/earthinversion/earthinversion-images/main/images/mac-automation/automator.jpg)
![Iphone shortcut to quickly log body temperature [ios]](https://raw.githubusercontent.com/earthinversion/earthinversion-images/main/images/iosShortcuts/Fig2.jpg)
![Mac quick action to rate the songs in apple music app [macos]](https://raw.githubusercontent.com/earthinversion/earthinversion-images/main/images/mac-quick-action/figure0.jpeg)
![Numerical tests on travel time tomography [matlab]](https://raw.githubusercontent.com/earthinversion/earthinversion-images/main/images/tomographyModel1.jpg)