Automatically Plotting Record Section for an Earthquake in the Given Time Range in Python (codes included)
Python code to automatically plot the record section for the highest magnitude earthquake in the given time range
Introduction
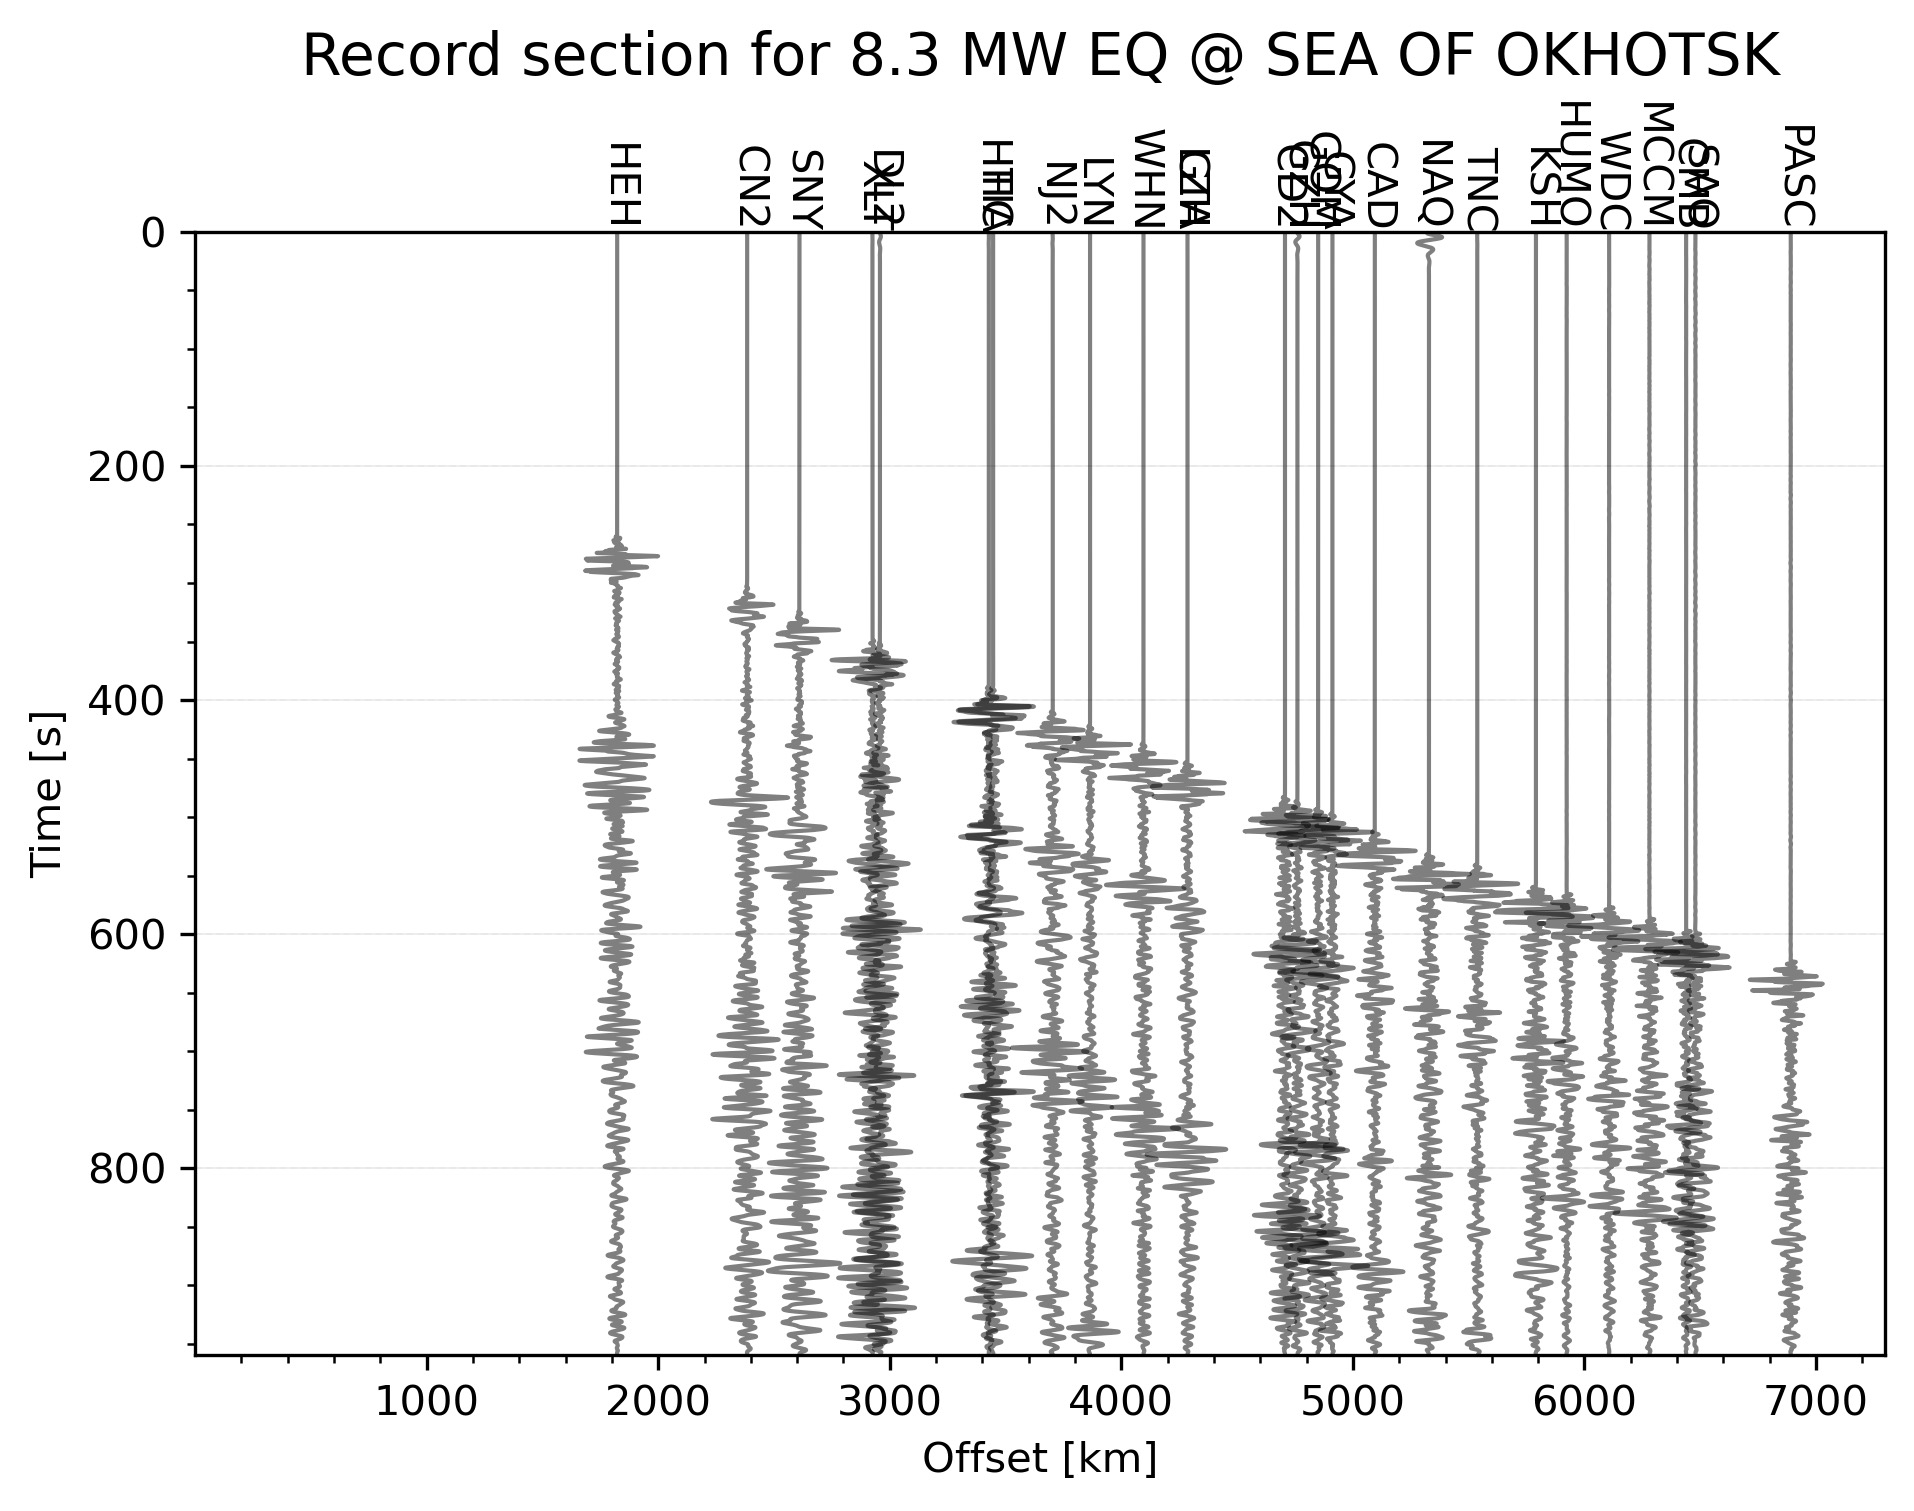
A seismic record section displays numerous seismic records in a single figure and can be quite useful in the geological interpretation. The ray paths of the seismic waves are curved due to increasing velocity with depth. Hence, the longer the distance to the station from the event, the deeper the ray goes.
- Code to automatically plot the record section of largest earthquake event within the given time range and geographical selection.
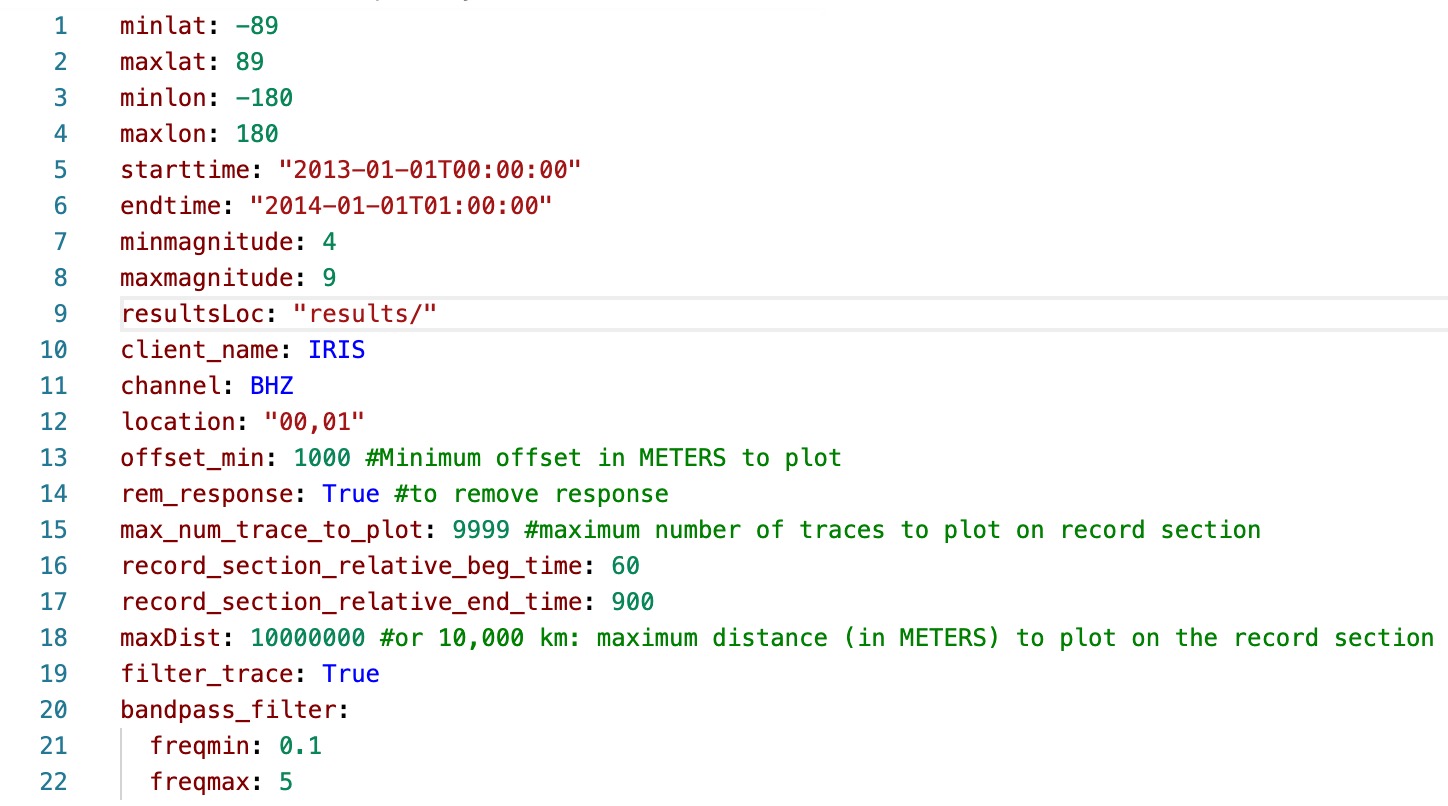
- Define the input parameters in
input_file.yml
Similar posts
- Run the python script
plot_record_section.py
Run Script
-
Install environment for the required packages using either one of the following commands (
spec-file.txtandenvironment.ymlcan be downloaded from the github link):conda install --name myenv --file spec-file.txtconda env create -f environment.yml -
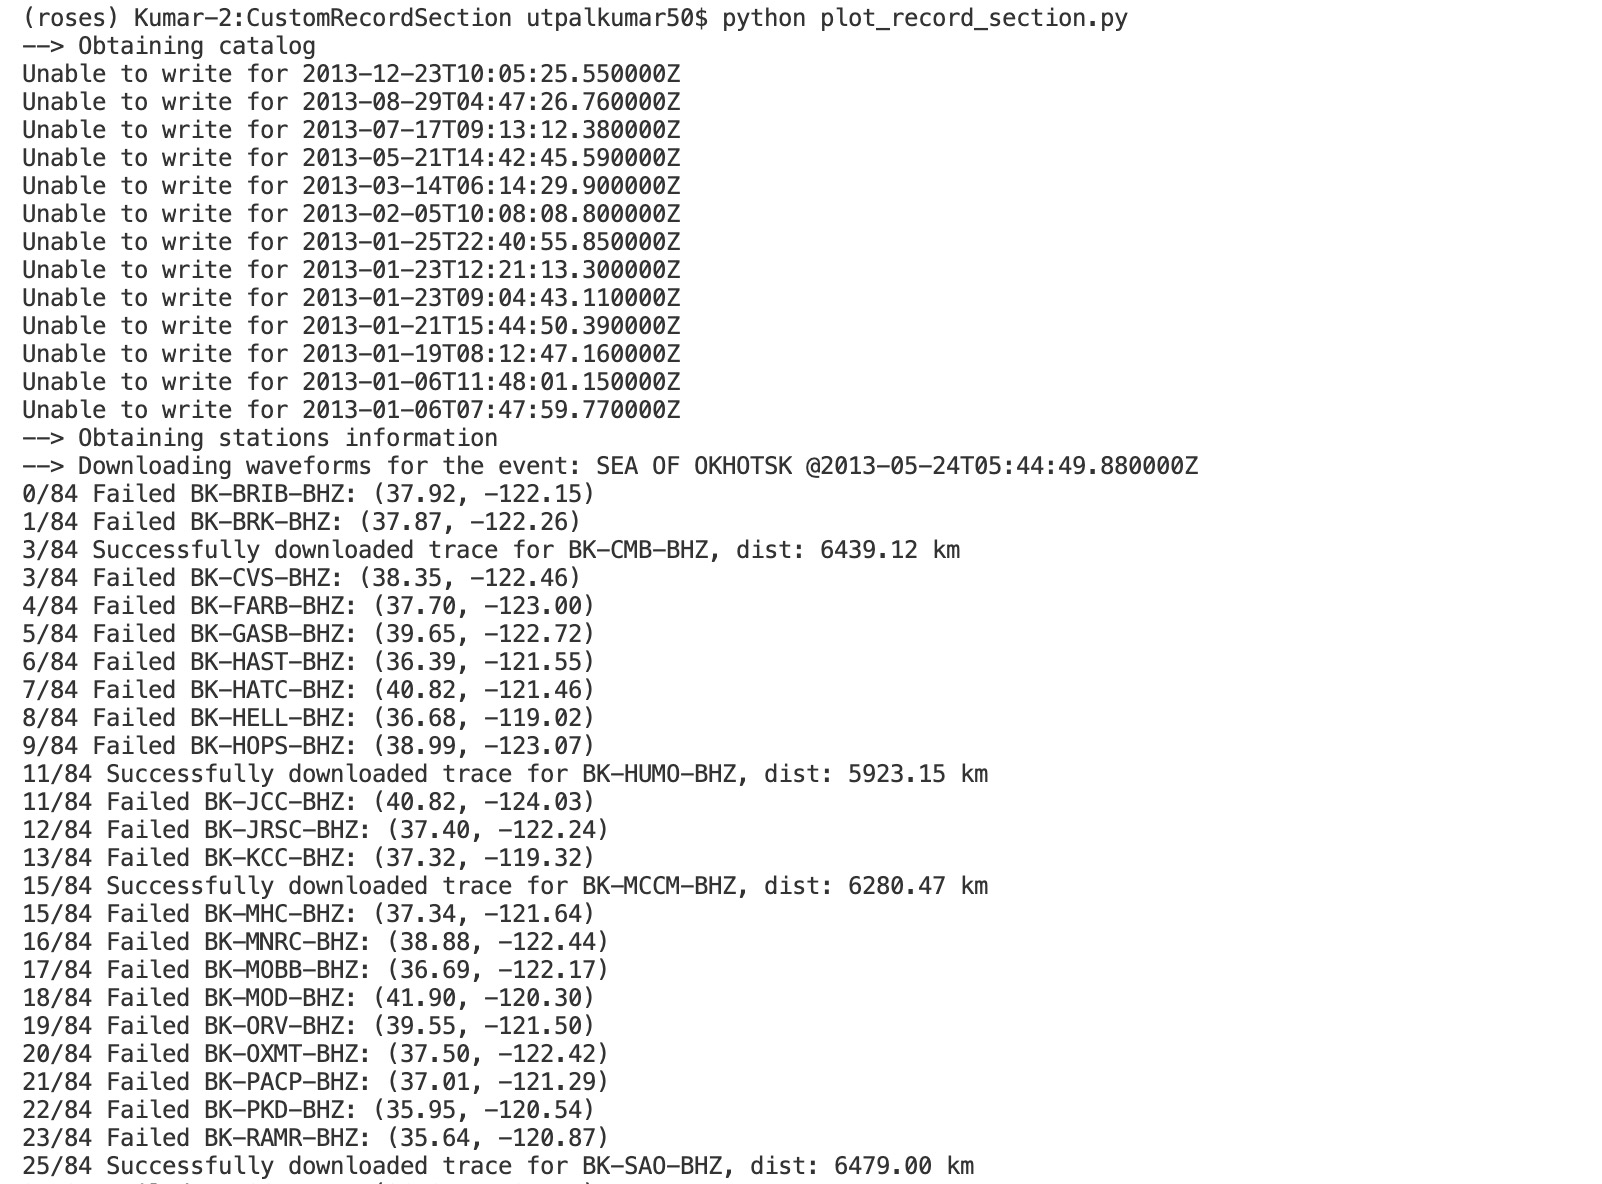
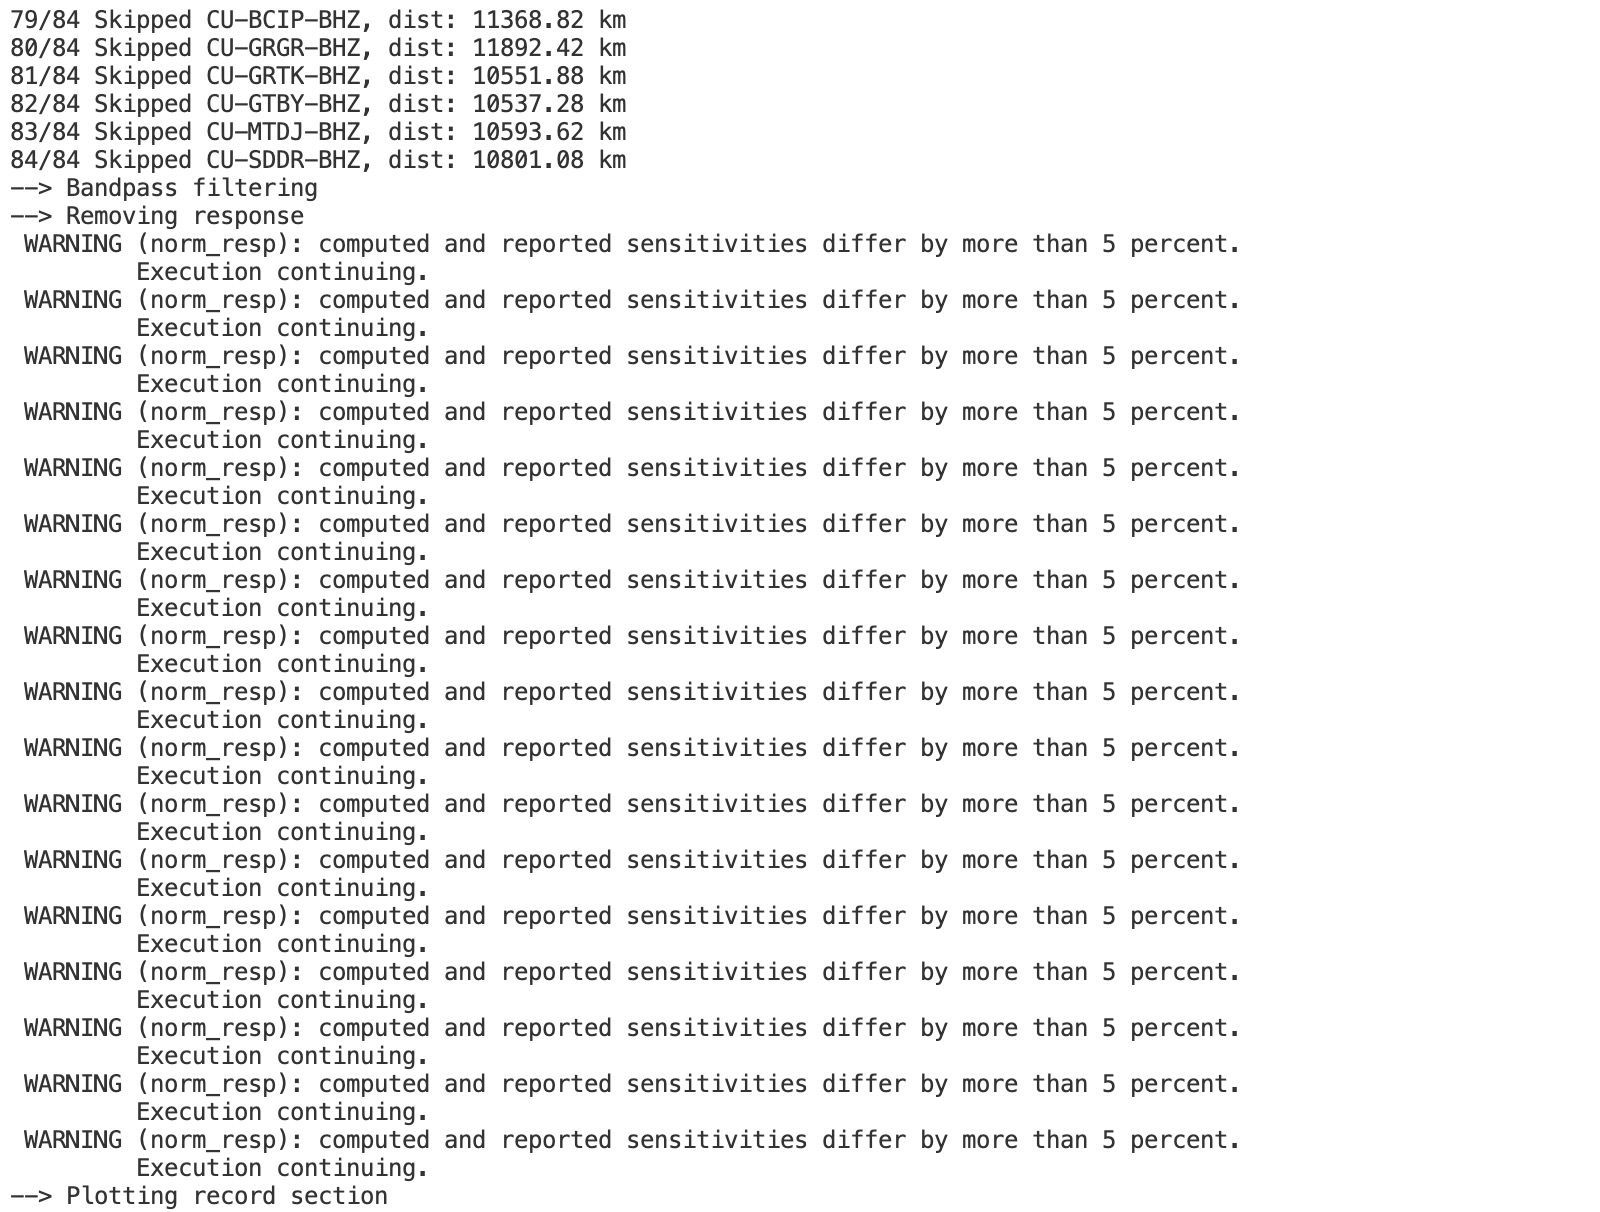
Execute script
python plot_record_section.py


Download the complete script here.
References
Disclaimer of liability
The information provided by the Earth Inversion is made available for educational purposes only.
Whilst we endeavor to keep the information up-to-date and correct. Earth Inversion makes no representations or warranties of any kind, express or implied about the completeness, accuracy, reliability, suitability or availability with respect to the website or the information, products, services or related graphics content on the website for any purpose.
UNDER NO CIRCUMSTANCE SHALL WE HAVE ANY LIABILITY TO YOU FOR ANY LOSS OR DAMAGE OF ANY KIND INCURRED AS A RESULT OF THE USE OF THE SITE OR RELIANCE ON ANY INFORMATION PROVIDED ON THE SITE. ANY RELIANCE YOU PLACED ON SUCH MATERIAL IS THEREFORE STRICTLY AT YOUR OWN RISK.

Leave a comment